Summary
- The Forest, Land, and Agriculture (FLAG) sector is a major contributor to global greenhouse gas emissions, representing nearly 25% of total emissions and facing significant challenges in measuring and managing carbon output.
- Companies must consider setting separate FLAG targets if they are in specific sectors or if FLAG-related emissions exceed 20% of their total Scope 1, 2, and 3 emissions.
- Companies in the FLAG sector are advised to set science-based targets for emissions reduction, focusing on near-term (5-10 years) and long-term goals aligned with limiting global warming to 1.5°C.
What is the FLAG (Forest, Land, and Agri) sector?
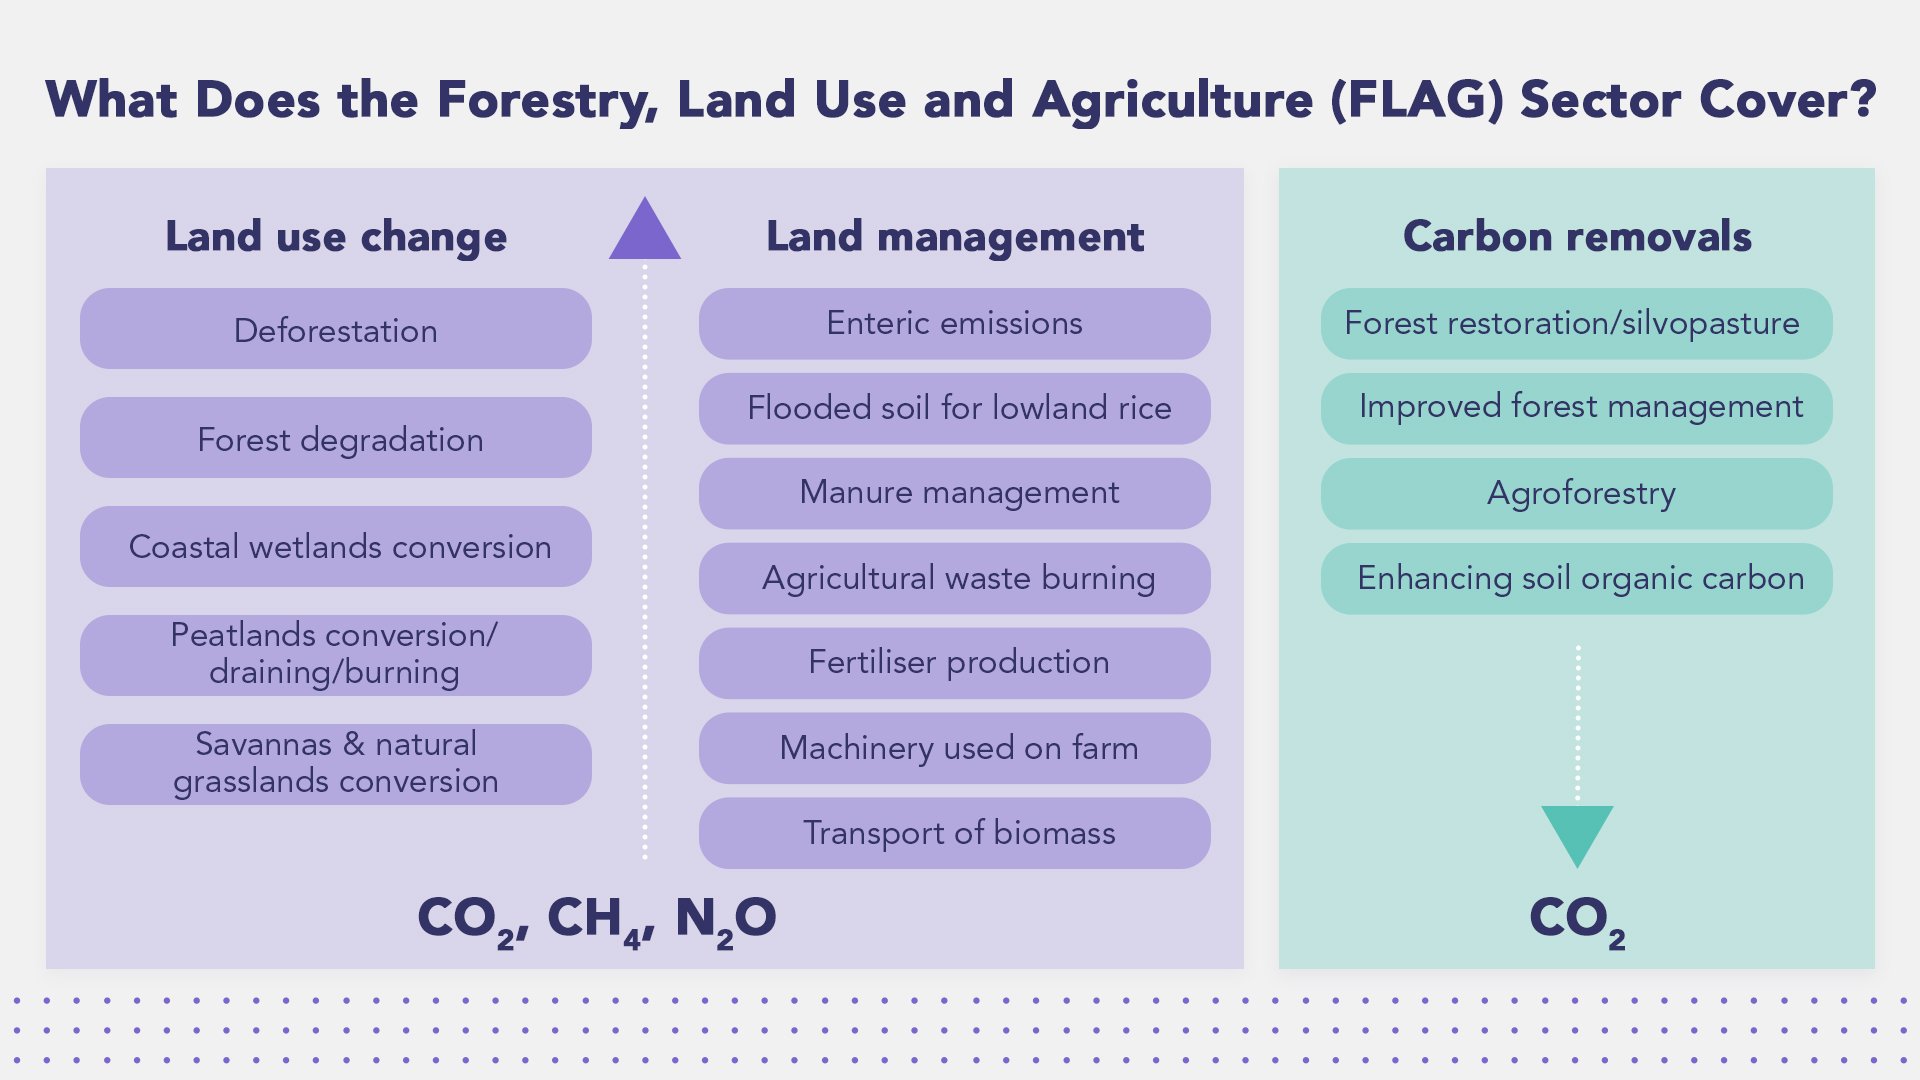
The Forest, Land, and Agriculture (FLAG) sector plays an important role in addressing climate change by reducing emissions and sequestering carbon. Not only is FLAG one of the sectors at highest risk from the impact of climate change, but it is also a significant source of emissions. It represents nearly a quarter of global greenhouse gas (GHG) emissions - the largest emitting sector after energy. It encompasses a range of activities including forest management, agriculture, and land use change, all of which have significant impacts on global GHG emissions. Companies operating in the FLAG sector should therefore measure and manage their emissions to effectively target climate change, in their transition to a low-carbon economy.

Challenges in measuring and managing emissions in the FLAG sector
Many businesses in the FLAG sector find measuring and managing their GHG emissions to be challenging due to various factors. The carbon measurement and management process can be complex, time-consuming, and unreliable - particularly if companies don’t have the right resources and tools. This is especially true for Scope 3 emissions, which refers to indirect upstream and downstream emissions generated by a company’s entire value chain. Here are some of the key challenges that the FLAG sector faces when measuring and reporting emissions.
- Gaps in data: According to the GHG Protocol, companies can use industry averages, proxies, and other sources to calculate emissions. However, this can result in inaccurate data and therefore, inaccurate measurements, making it difficult for companies to establish a baseline. There is a lack of comprehensive and comparable data in the FLAG sector, which is needed to efficiently price climate-related risks and avoid greenwashing. According to the IMF, this data deficit poses a serious obstacle to the energy and ecological transition, which requires FLAG industries to migrate toward low-carbon alternatives. This entails hefty new investments in measurement, management, and mitigation.
- High costs of emission measurement and management: The UNFCCC has identified some financial barriers that agricultural enterprises may face. This includes high transaction costs, concerns about competitiveness, or in some cases, unavailability of investment capital to accommodate the relatively high costs for measuring and monitoring emissions and reductions.
- Lack of regulations and global cooperation: The UNFCCC also noted that non-climate policies related to macroeconomics, agriculture and the environment have a larger impact on agricultural mitigation than climate policies. Reducing GHG emissions in the FLAG sector will require global cooperation from policymakers and businesses alike, alongside other endeavors, such as adopting and promoting innovative technologies.
- Lack of standardization in reporting formats: While several reporting guidelines such as the GRI Standards and the ISSB have been put in place to create consistency in emissions reporting, there is still no universal format for measuring and reporting sustainability performance. There are also a variety of methodologies and metrics that companies use to measure and report Scope 3 emissions, each one with its unique upsides and downsides.
- Limited resources and capacity for emissions management: Measuring emissions is an expensive, time-consuming affair, especially for large FLAG conglomerates with multiple products and value chains. Some companies may not have the resources or capacity to conduct this exercise, while others may not be able to effectively collaborate with their supply partners to get visibility on accurate data.
How companies can set FLAG targets
According to the Science Based Targets initiative (SBTi), which has created extensive guidelines for the FLAG sector, companies looking to set FLAG targets must consider the following steps.
- Set near-term FLAG science-based targets: 5-10 year emission reduction targets in line with limiting warming to 1.5°C.
- Account for land-based removals in near-term FLAG science-based targets: GHG land-based removals include things like improving forest management practices, and enhancing soil carbon sequestration on working lands. Read more on how the FLAG pathways address carbon removals here.
- Set long-term FLAG science-based targets: By setting the SBTi FLAG targets, companies in the FLAG sectors will reduce at least 72% of emissions by no later than 2050. Therefore, they should use the SBTi Net-Zero Standard to set long-term FLAG science-based targets.
- Establish no-deforestation commitment, with targets set no later than 2025: In line with the Accountability Framework initiative (AFi). Read more on how this guidance accounts for land-use change emissions here.
- Set science-based targets for fossil emissions:
Businesses with land-based emissions are required to set both FLAG science-based targets AND science-based targets since all companies produce fossil emissions.
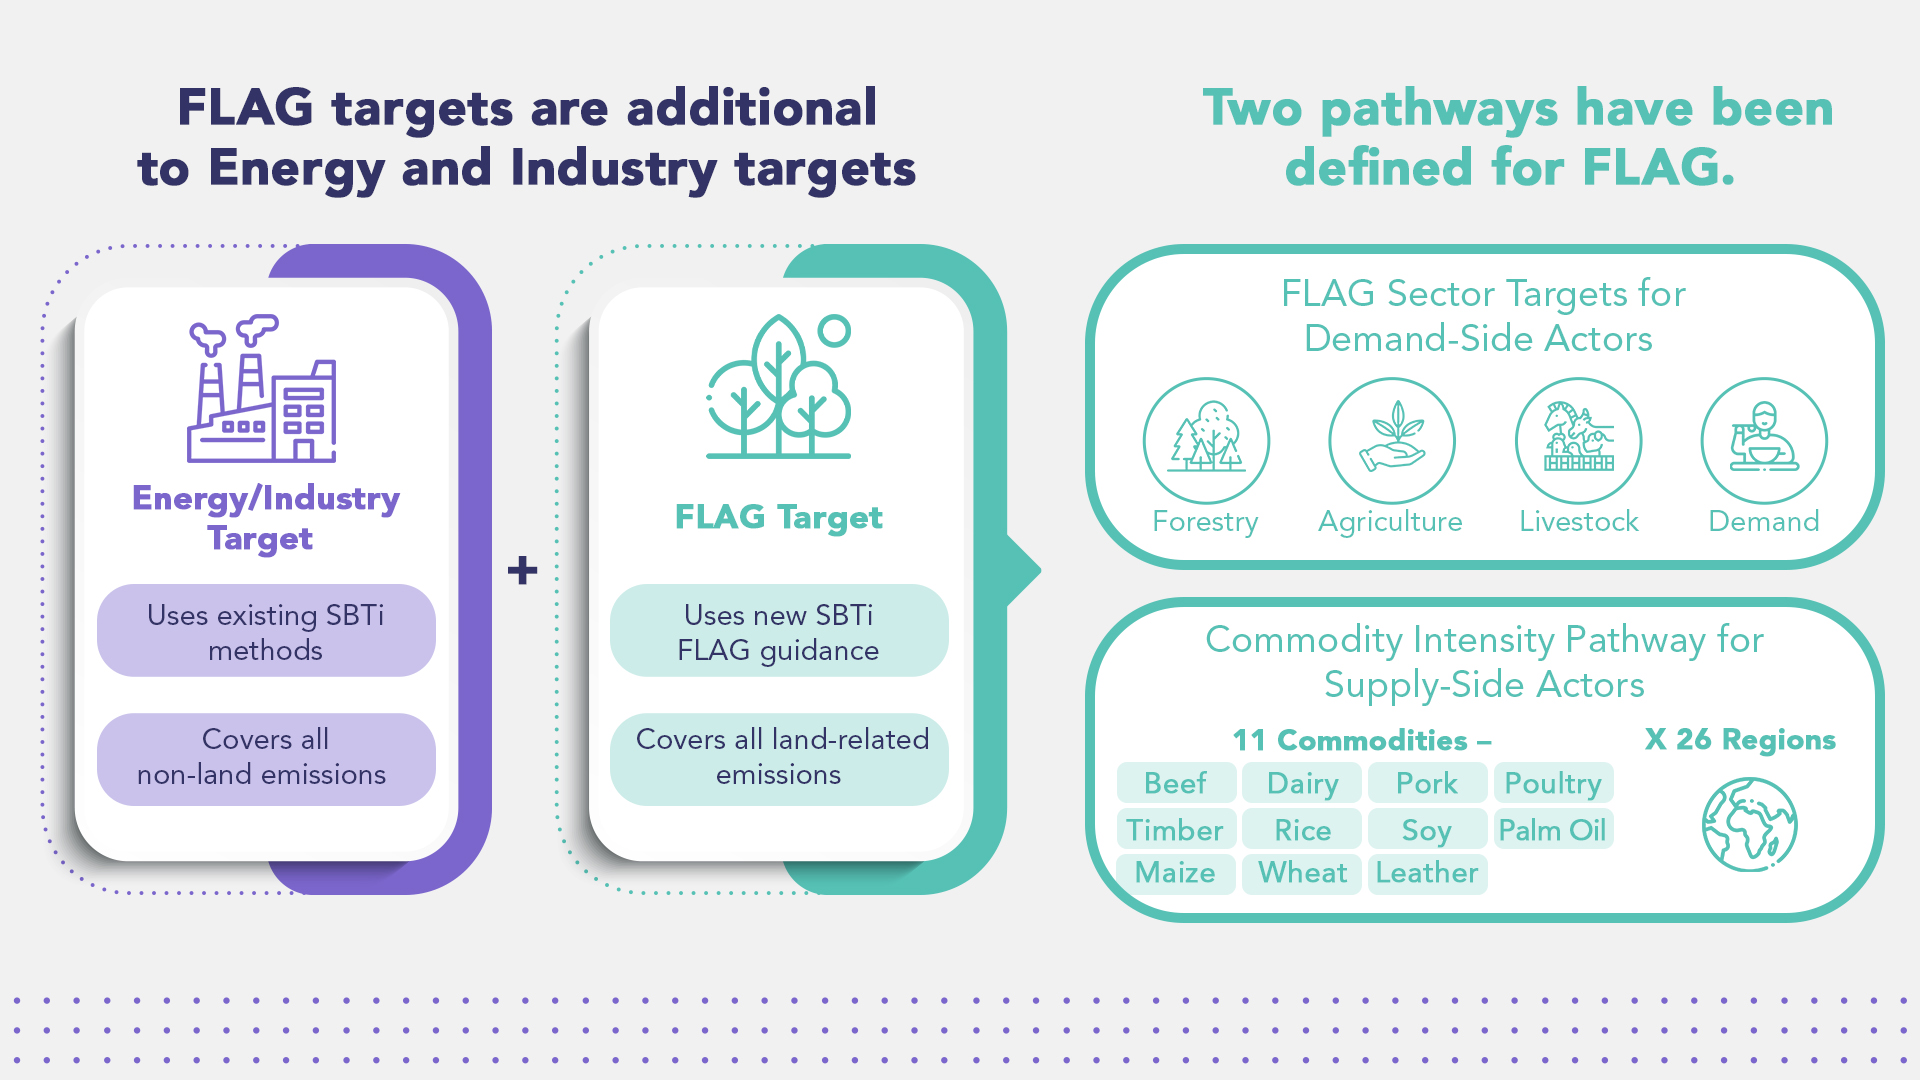
FLAG targets are additional to Energy and Industry targets
According to the SBTi, companies that meet either of the following two conditions should set FLAG-specific targets separate from their targets for other emissions:
- Companies from the following SBTi-designated sectors: Forest and paper products (forestry, timber, pulp and paper); food production (agricultural production); food production (animal source); food and beverage processing; food and staples retailing; and tobacco.
- Companies in any other sector with FLAG-related emissions that total more than 20% of overall emissions across Scope 1, 2, and 3. The 20% threshold should be accounted for as gross emissions rather than net emissions, where net emissions are defined as gross emissions minus removals.
When setting additional FLAG targets, enterprises should consider the following:
- Establish a baseline year that the company will measure their emission reduction against.
- When establishing FLAG targets, companies should be able to account and report land-based emissions (i.e., land use change and land management) and removals separately.
- For processed products such as cocoa butter, it is advisable for companies to trace the emissions of the primary commodities that the products are derived from.
- Companies will also have to select the appropriate pathway(s) for setting FLAG targets (i.e., sectoral, commodity-specific approach), depending on the operations that the company is involved in and the geographical location of these operations.

How Terrascope Supports the FLAG Sector

Investors and consumers are becoming more discerning about climate targets and plans, and how they align with the sustainability framework outlined by the Paris Agreement. By effectively measuring, managing, and mitigating GHG emissions, companies can align their corporate sustainability strategies with the national and global sustainability goals necessary to combat climate change. This can also strengthen your business against climate-related risks as well as regulatory changes.
Terrascope’s SaaS carbon measurement and management platform can help FLAG enterprises understand and mitigate their emissions. The platform’s machine learning capability allows for faster data ingestion (when compared to the manual process) and improved data granularity - both of which can help create meaningful and sustainable change within companies as well as on the planet as a whole. Terrascope can assist the FLAG sector as well as companies with FLAG targets in the following ways -
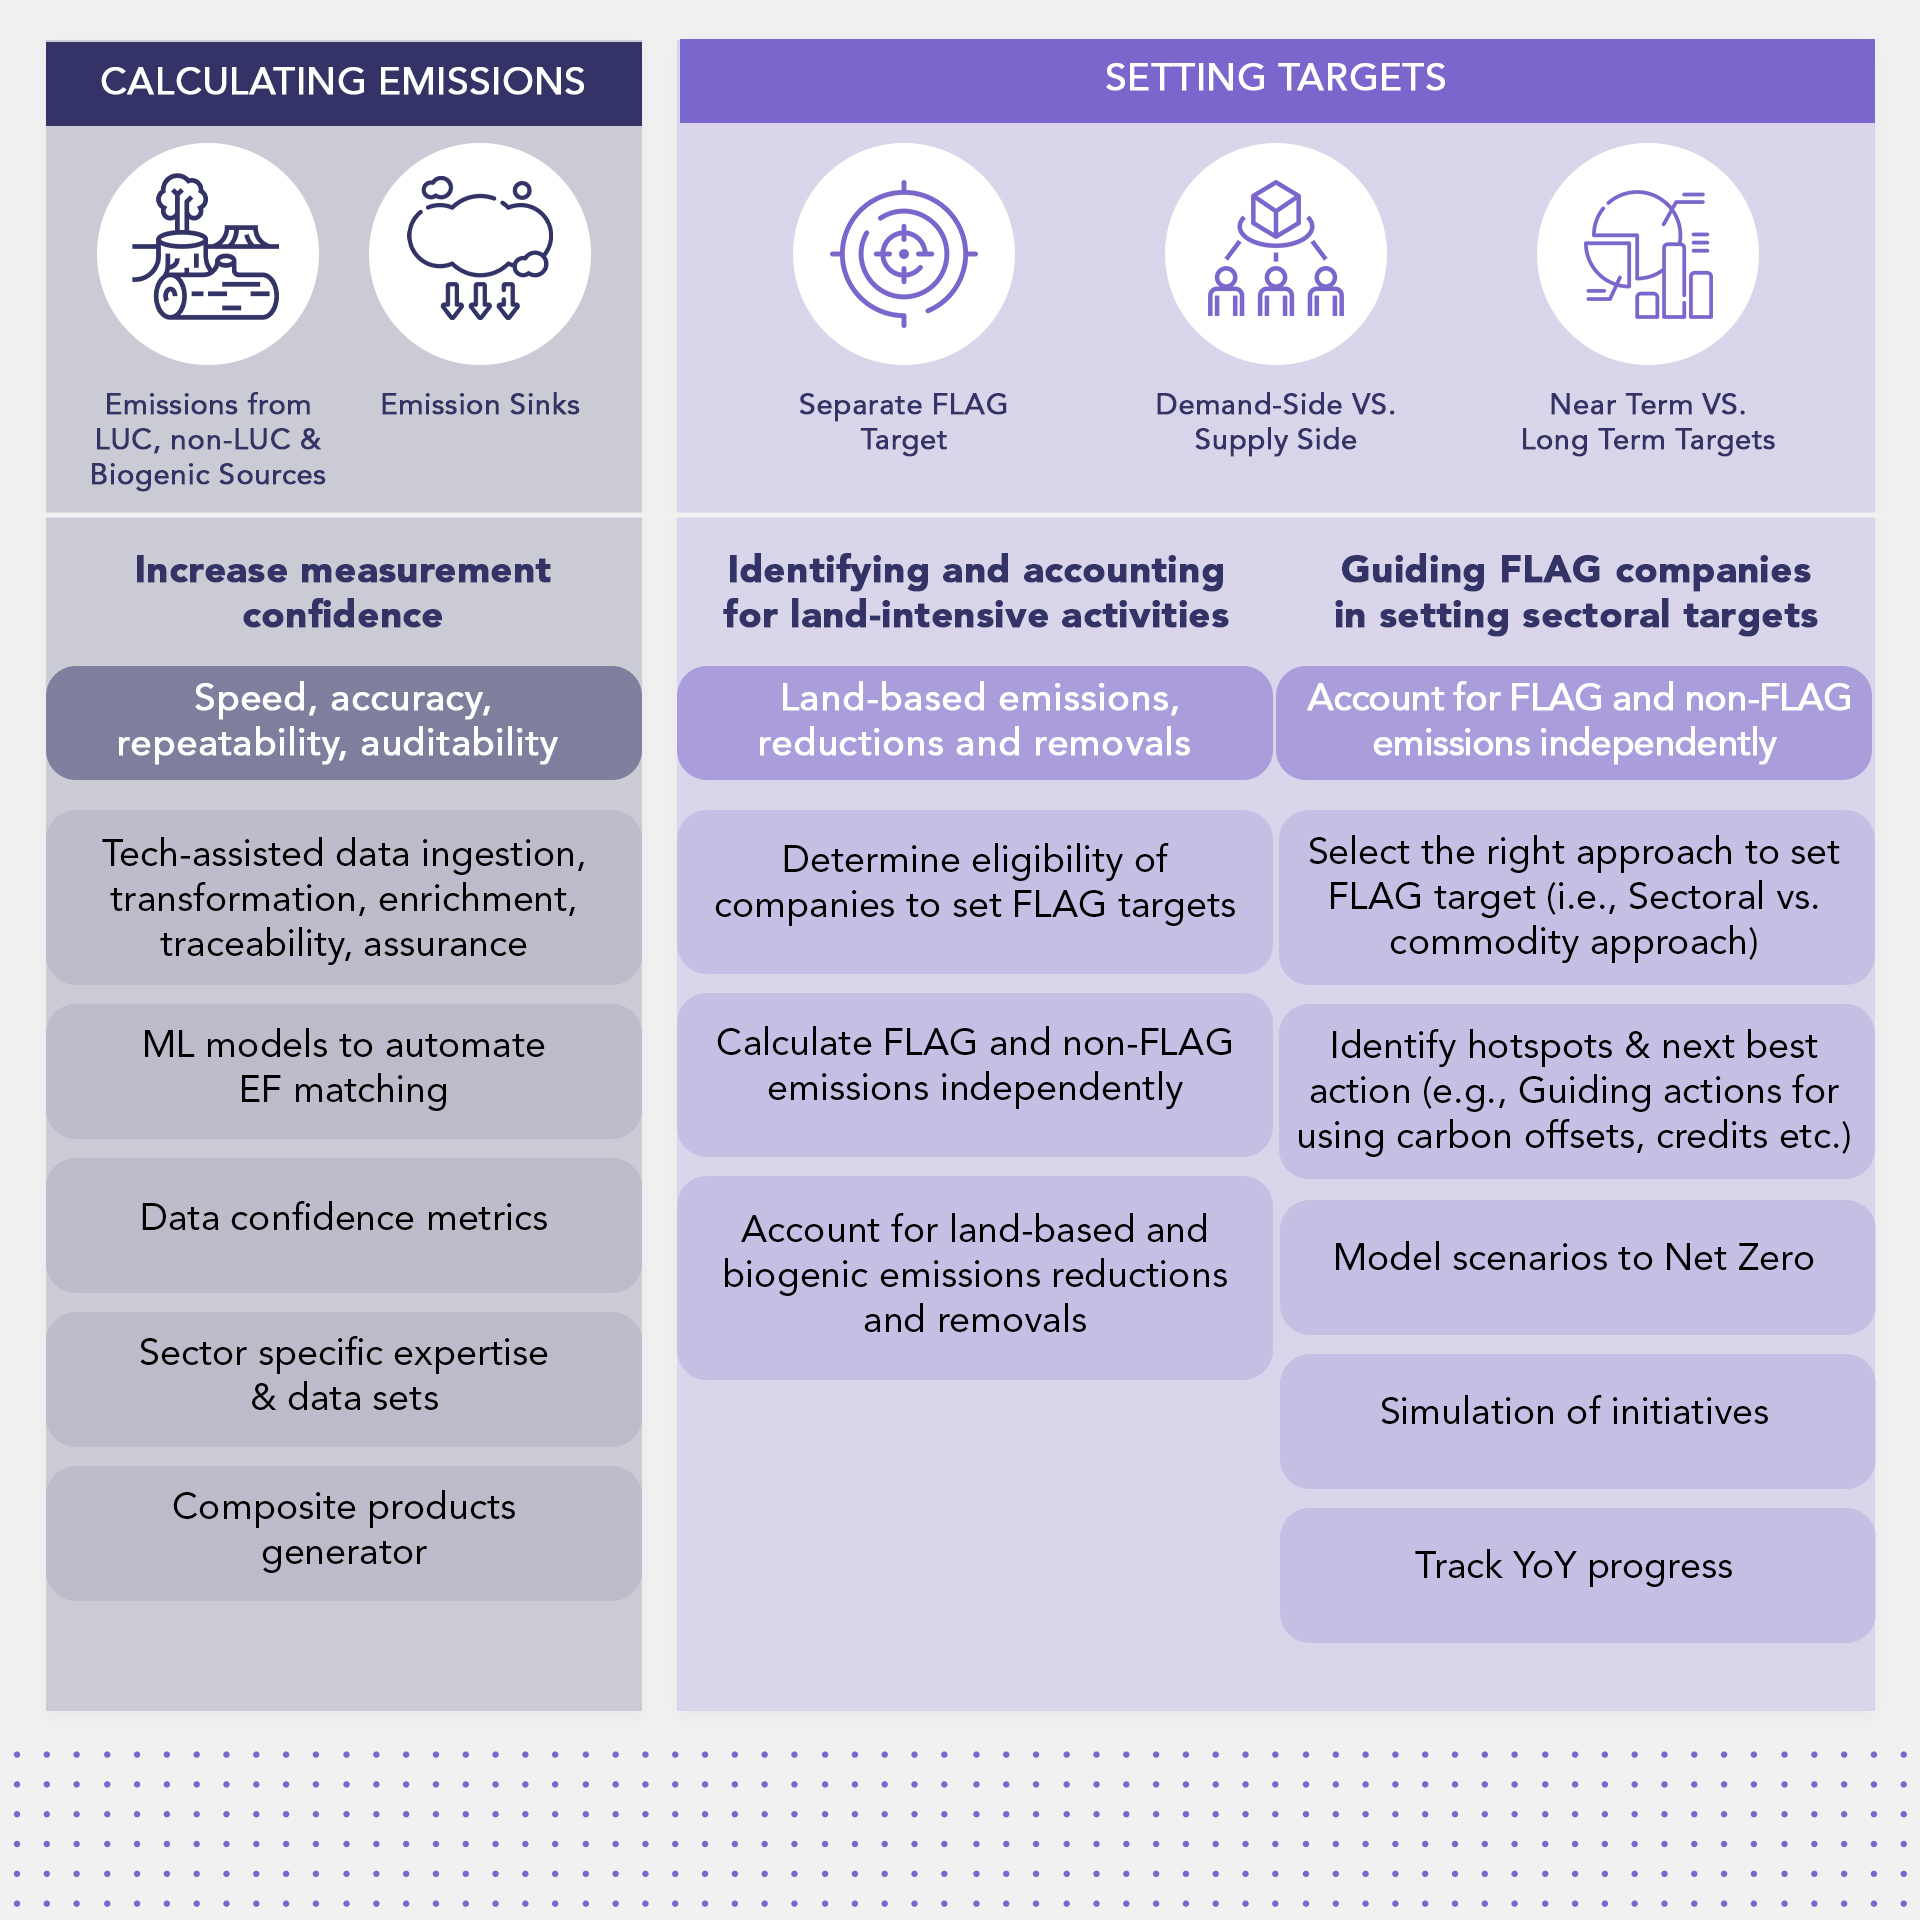
- Terrascope’s platform is able to account for and separate biogenic and non-biogenic related emissions, as well as LUC and non-LUC emissions and out-of-scope emissions.
- The platform is able to visualise and separate carbon removal (tCO2e).
- Not only can Terrascope identify whether companies are required to set FLAG targets based on FLAG and non-FLAG emission proportions, but it can also assist companies in setting FLAG and non-FLAG targets (i.e., by accounting for FLAG and non-FLAG emissions independently.
- It can guide companies in choosing the right approach in accounting for FLAG emission (i.e., sector or commodity approach), as well as provide quantitative figures towards target reporting and validation.
How Terrascope can help
The Terrascope platform leverages machine learning to help companies assimilate and analyze data while using relevant emissions factors to fill in gaps in data. Companies in the FLAG sector as well as in other sectors can collaborate with Terrascope to account for land-intensive activities and identify whether they exceed the threshold of 20% of emissions from FLAG sources across scopes 1, 2 and 3 emissions. This will help them assess whether they require setting additional FLAG science-based targets separately.
The platform can also simulate reduction scenarios, which can help companies identify appropriate pathways to set FLAG targets. The platform accounts for land-based emissions (i.e., land-use change and land management practices) and removals within FLAG target-setting boundaries (i.e., cradle to farm gate or yard). In the case of processed products, Terrascope would be able to map what are the raw commodities that make up these processed products; and account for the equivalent land-based emissions and removals accordingly.


